SNOMED Documentation Search
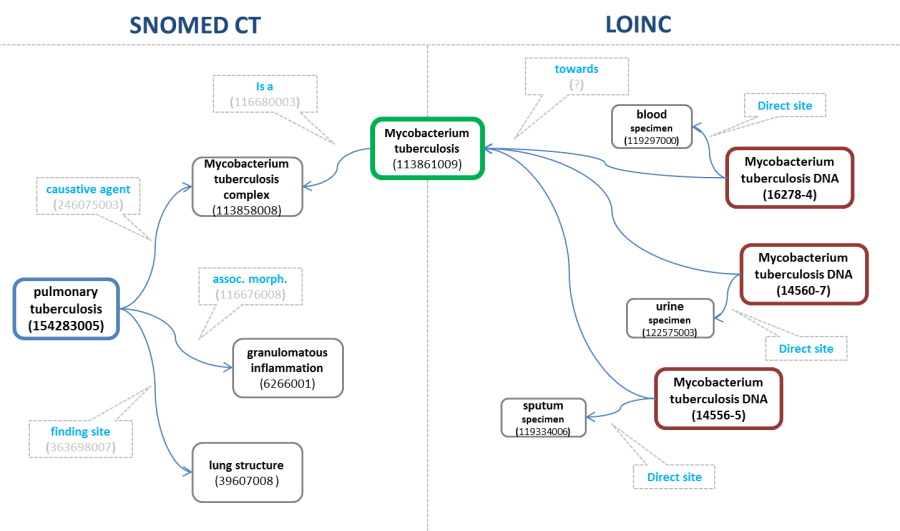
A GP needs to confirm a diagnosis of Pulmonary Tuberculosis. To do so, launches a query in order to obtain all the related lab tests.
| Caption label | ||||
|---|---|---|---|---|
| ||||
Link between causative agent organism and tests for organisms |
System retrieves all those clinical lab tests which component (towards) is related to the causative agent of the disease.
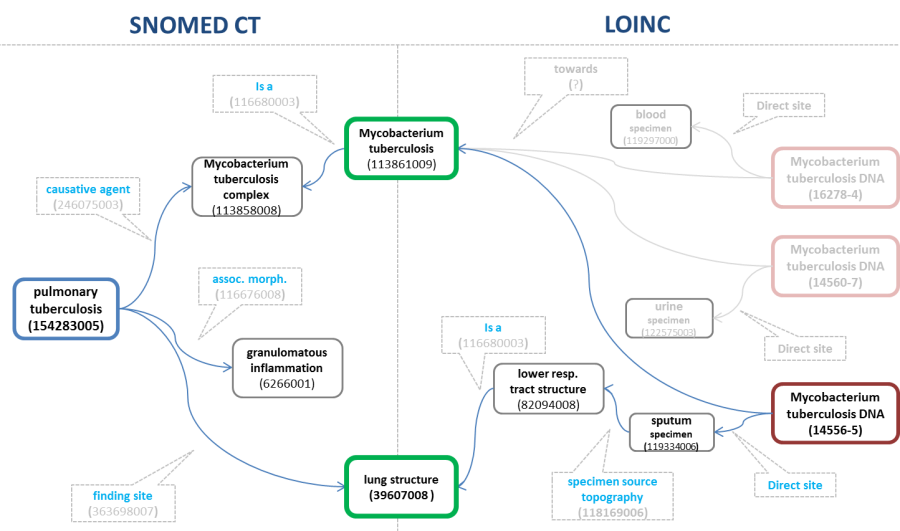
It is possible to refine the selection by considering the relationship between the disease finding site and the specimen source topography.
| Caption label | ||||
|---|---|---|---|---|
| ||||
Link between finding site of disorder and specimen |
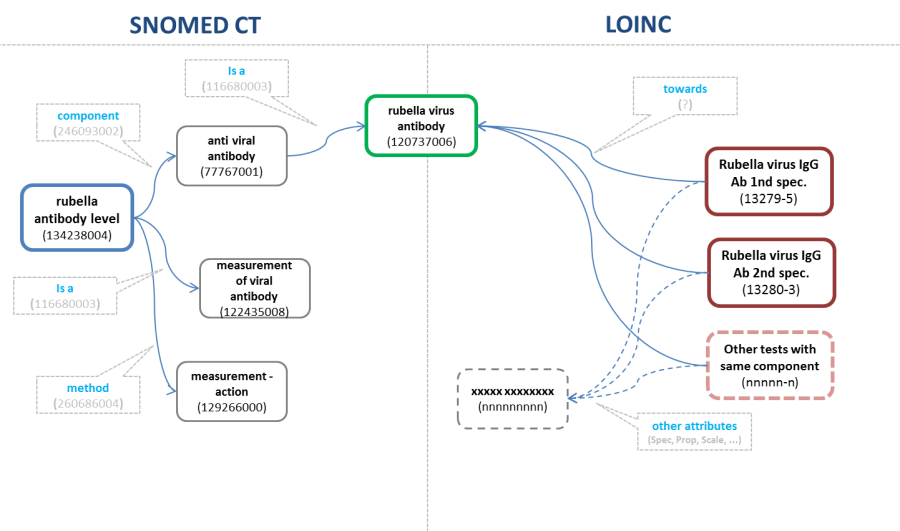
A GP needs to check vaccinations status level for rubella and queries the system for which lab tests are related.
| Caption label | ||||
|---|---|---|---|---|
| ||||
Link between antibody in SNOMED CT and LOINC |
System retrieves all those clinical lab tests which component (towards) is equivalent to the component of the evaluation procedure.
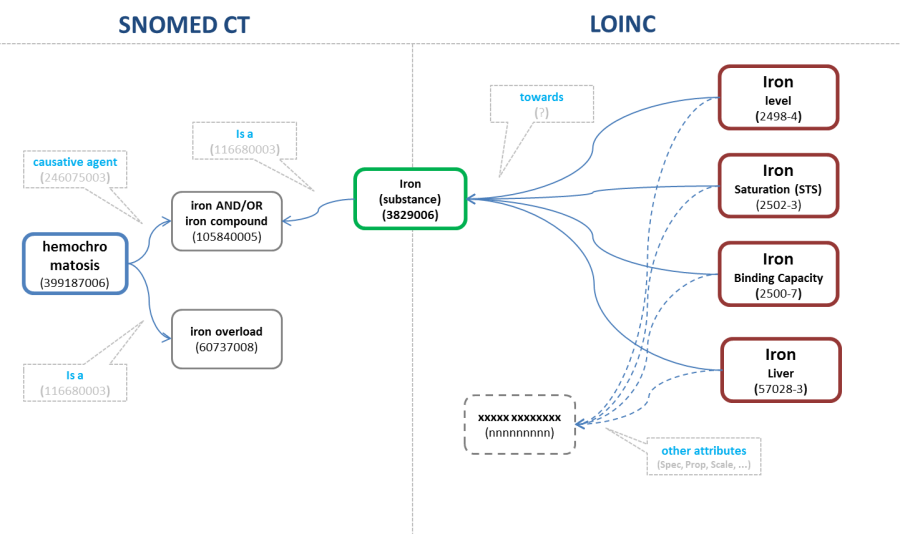
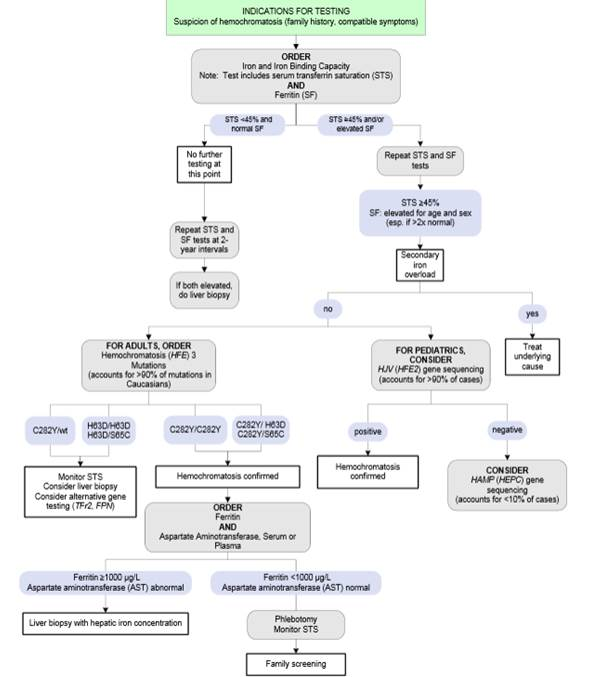
A GP needs to confirm a diagnosis of Hemochromatosis. To do so, launches a query in order to obtain related lab tests.
| Caption label | ||||
|---|---|---|---|---|
| ||||
Link between substance in SNOMED CT and measurement in LOINC |
System retrieves all those clinical lab tests which component (towards) is related to the causative agent of the disease.
The semantic net shown in the previous graphics, could be used as a basis for decision algorithm optimization as shown in
| Caption reference | ||||
|---|---|---|---|---|
|
| Caption label | ||||
|---|---|---|---|---|
| ||||
RUP HFE decision algorithm |
| Caption label | ||||
|---|---|---|---|---|
| ||||
Illustrations of Implementation of LOINC and SNOMED CT in the Interface Between Laboratory Data and EHR |
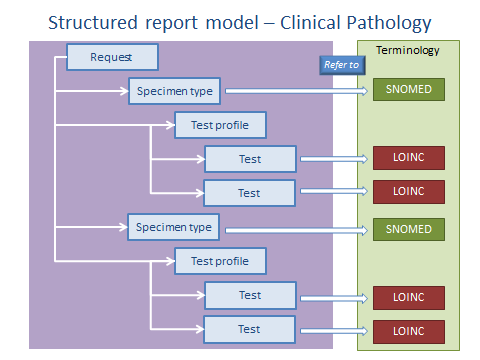
| Diagram of Simplified Information Model | Description |
| This diagram illustrates a general case of a laboratory test on two specimens (coded with SNOMED CT) and test profiles containing four tests (coded using LOINC) two of which are applied to each of these specimens. |
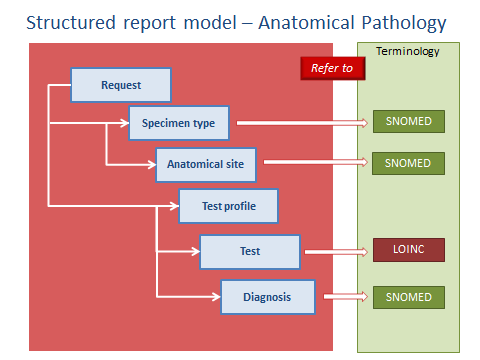
| This diagram illustrates an anatomical pathology test for a specimen (e.g. a biopsy) taken from a particular site. Both the specimen type and site are coded using SNOMED CT. In this case the test is coded using LOINC and the diagnosis arising from the interpretation of the test result is coded using SNOMED CT. |
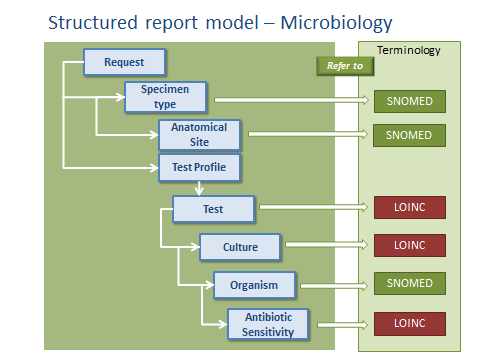
| This diagram outlines a recommended approach to representing a structured microbiology report using SNOMED CT and LOINC for different elements. |
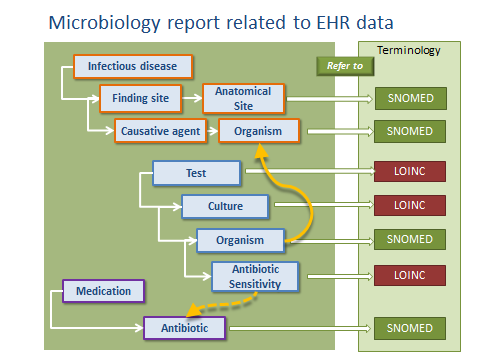
| This diagram illustrates relationships between EHR entries coded using SNOMED CT and a microbiology report coded using the mixture of LOINC and SNOMED shown above. |
Note: The diagrams in this table are based on illustrations used in presentation by Hong Kong Hospital Authority (HKHA) as part of their work on matching their requirements to a combination of SNOMED CT and LOINC coding. | |
| Page break |
|---|